

Visualizing Performance Fluctuations for College Women Athletes
Thesis · Independent Research
Project TypeMy RoleResearcher / Interaction Design / Visual System / Prototyping / 3D Character Design / Scenario Videos
LocationRaleigh,NC
Year2026
Software and techniques usedFigma – interface architecture, layered explanation UI, high-fidelity prototyping, interaction flow mapping
Adobe Premiere – scenario-based motion studies and interaction simulations
Spline & Meshy – 3D posture modeling and avatar system for embodied internal-state representation
Illustrator / Photoshop – system diagrams, visual exploration, conceptual maps
Project DescriptionThis thesis investigates how temporal and layered interface design can help college women athletes interpret their own performance fluctuations — specifically how training load and menstrual cycle variability interact over time to shape their physical state. Despite a record 242,341 female student-athletes in the NCAA (2023–24), only 35% of sports performance research includes women.
This project responds to that gap by designing a system that makes AI reasoning interpretable for athletes rather than coaches or technicians — centering the athlete as the primary decision-maker in understanding her own body.

UX/UI DesignProblem Statement
Research continues to reveal strong links between menstrual-cycle phases and women’s athletic performance. However, most existing systems still provide limited support for interpreting how training load and physiological variability interact. At the same time, interactive systems are often designed as gender-neutral, overlooking women’s lived physiological experiences.
Talking to Athletes
The Professionals
●Former D2 Softball Athlete
●Non-College Ski Trainer
●Active University Basketball Athlete
●Former University Basketball Athlete (photo not included by request)

What They Shared
●Athletes navigate tension between data and bodily experience.
●While wearable metrics are widely collected, they are rarely explained,leaving athletes confused when data mismatch with their lived experience.
●Menstrual cycle fluctuations further shape training capacity, yet athletes often feel pressure to suppress or ignore these changes within competitive environments. As a result, generic AI or coaching advice fails to account for individual variation, leading to confusion and loss of trust.
●Athletes prefer explanations over automated decisions to maintain control.
Precedents
Current training platforms surface large amounts of data, but rarely explain why it matters or how it connects to the athlete’s lived experience.

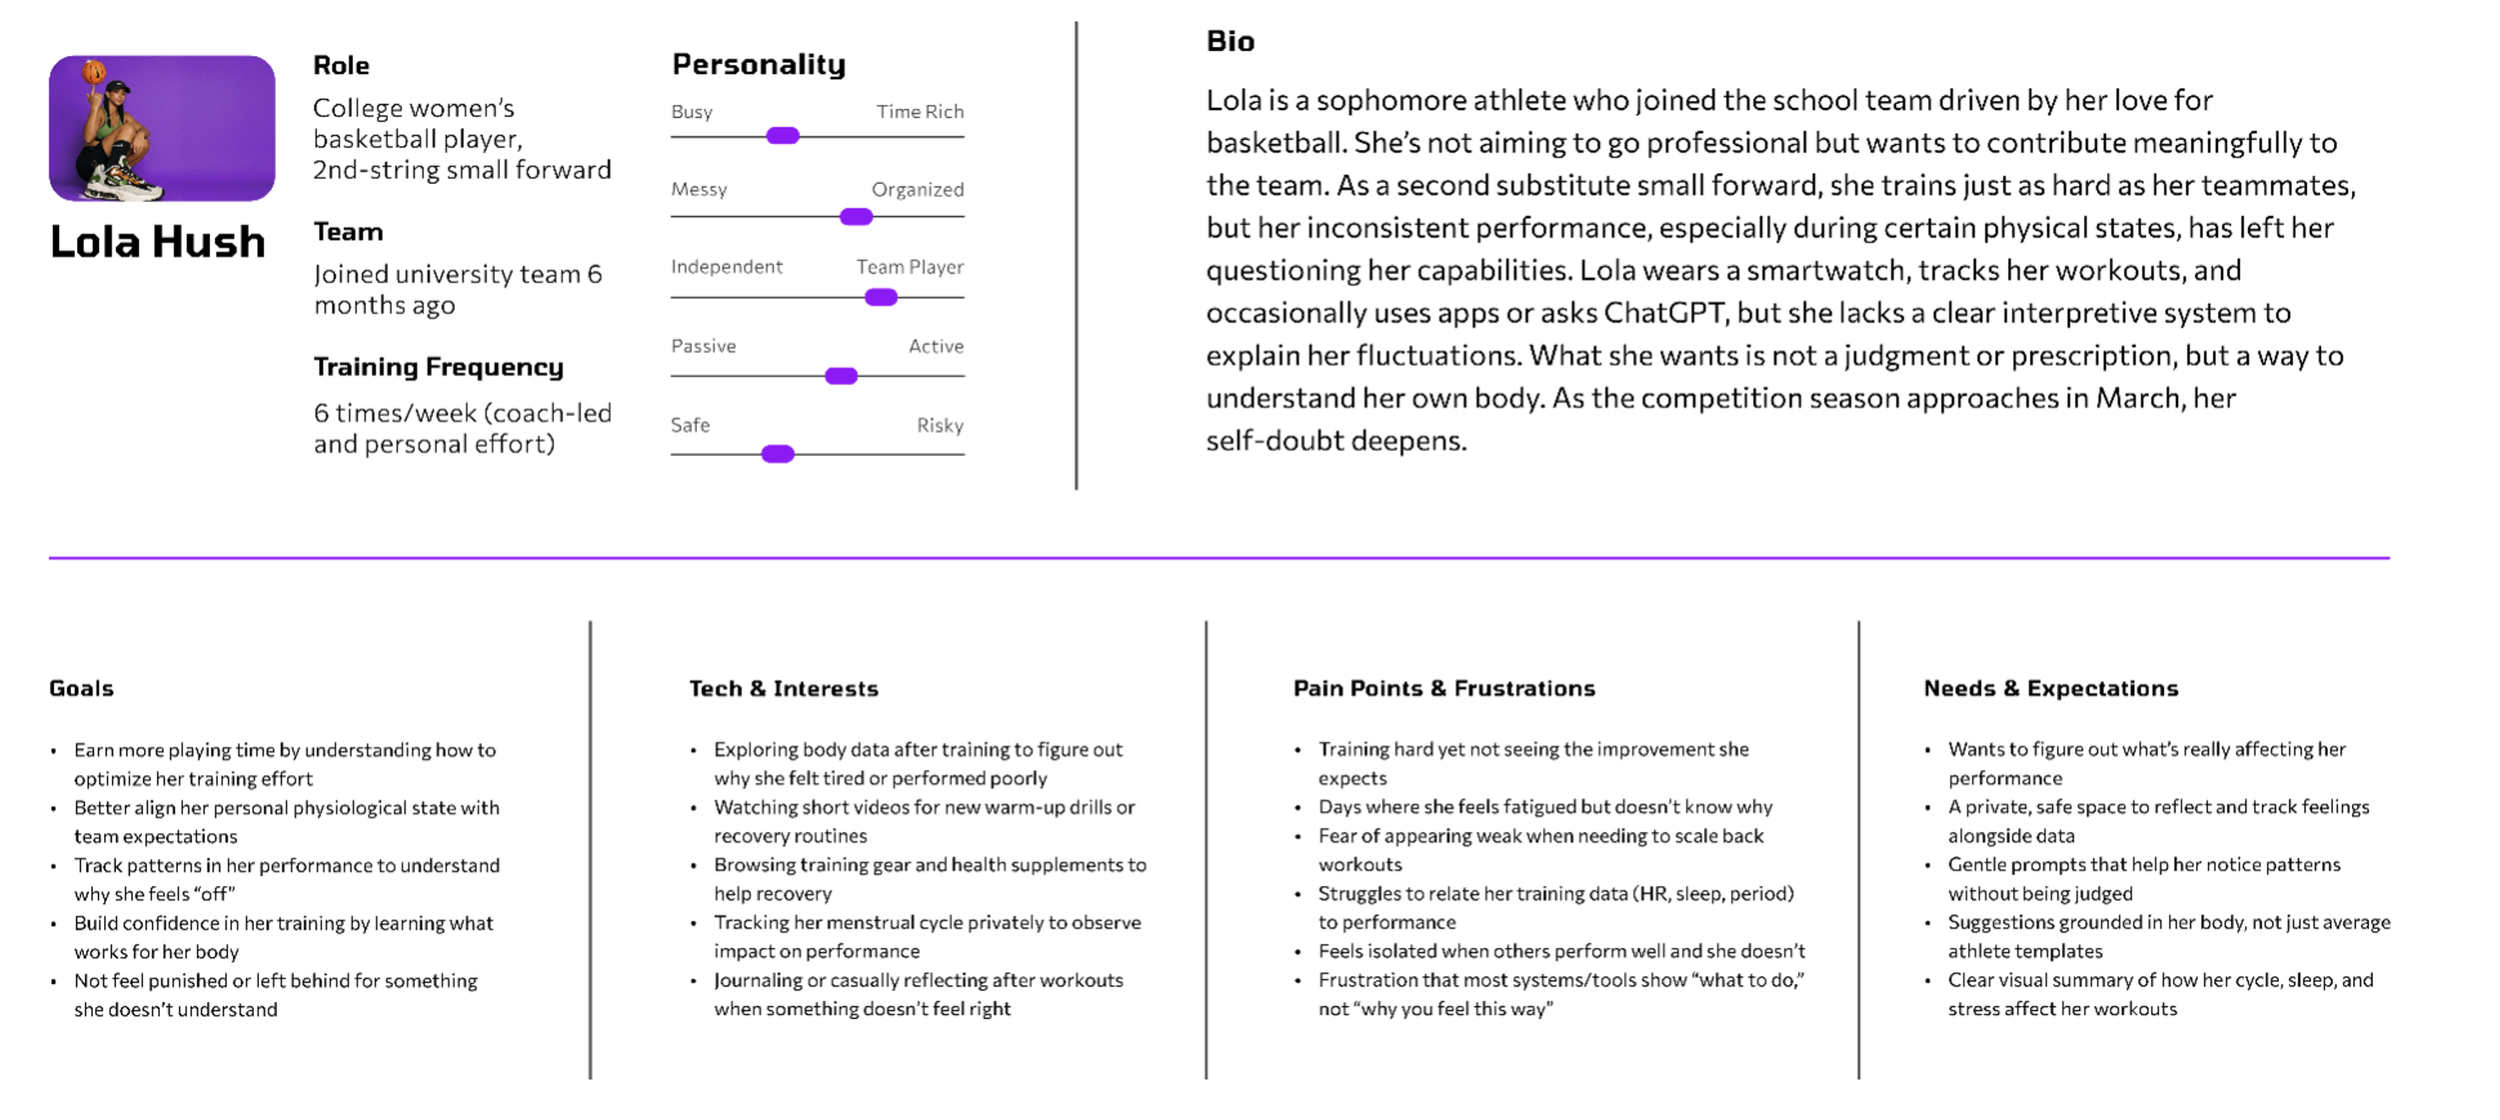
Persona
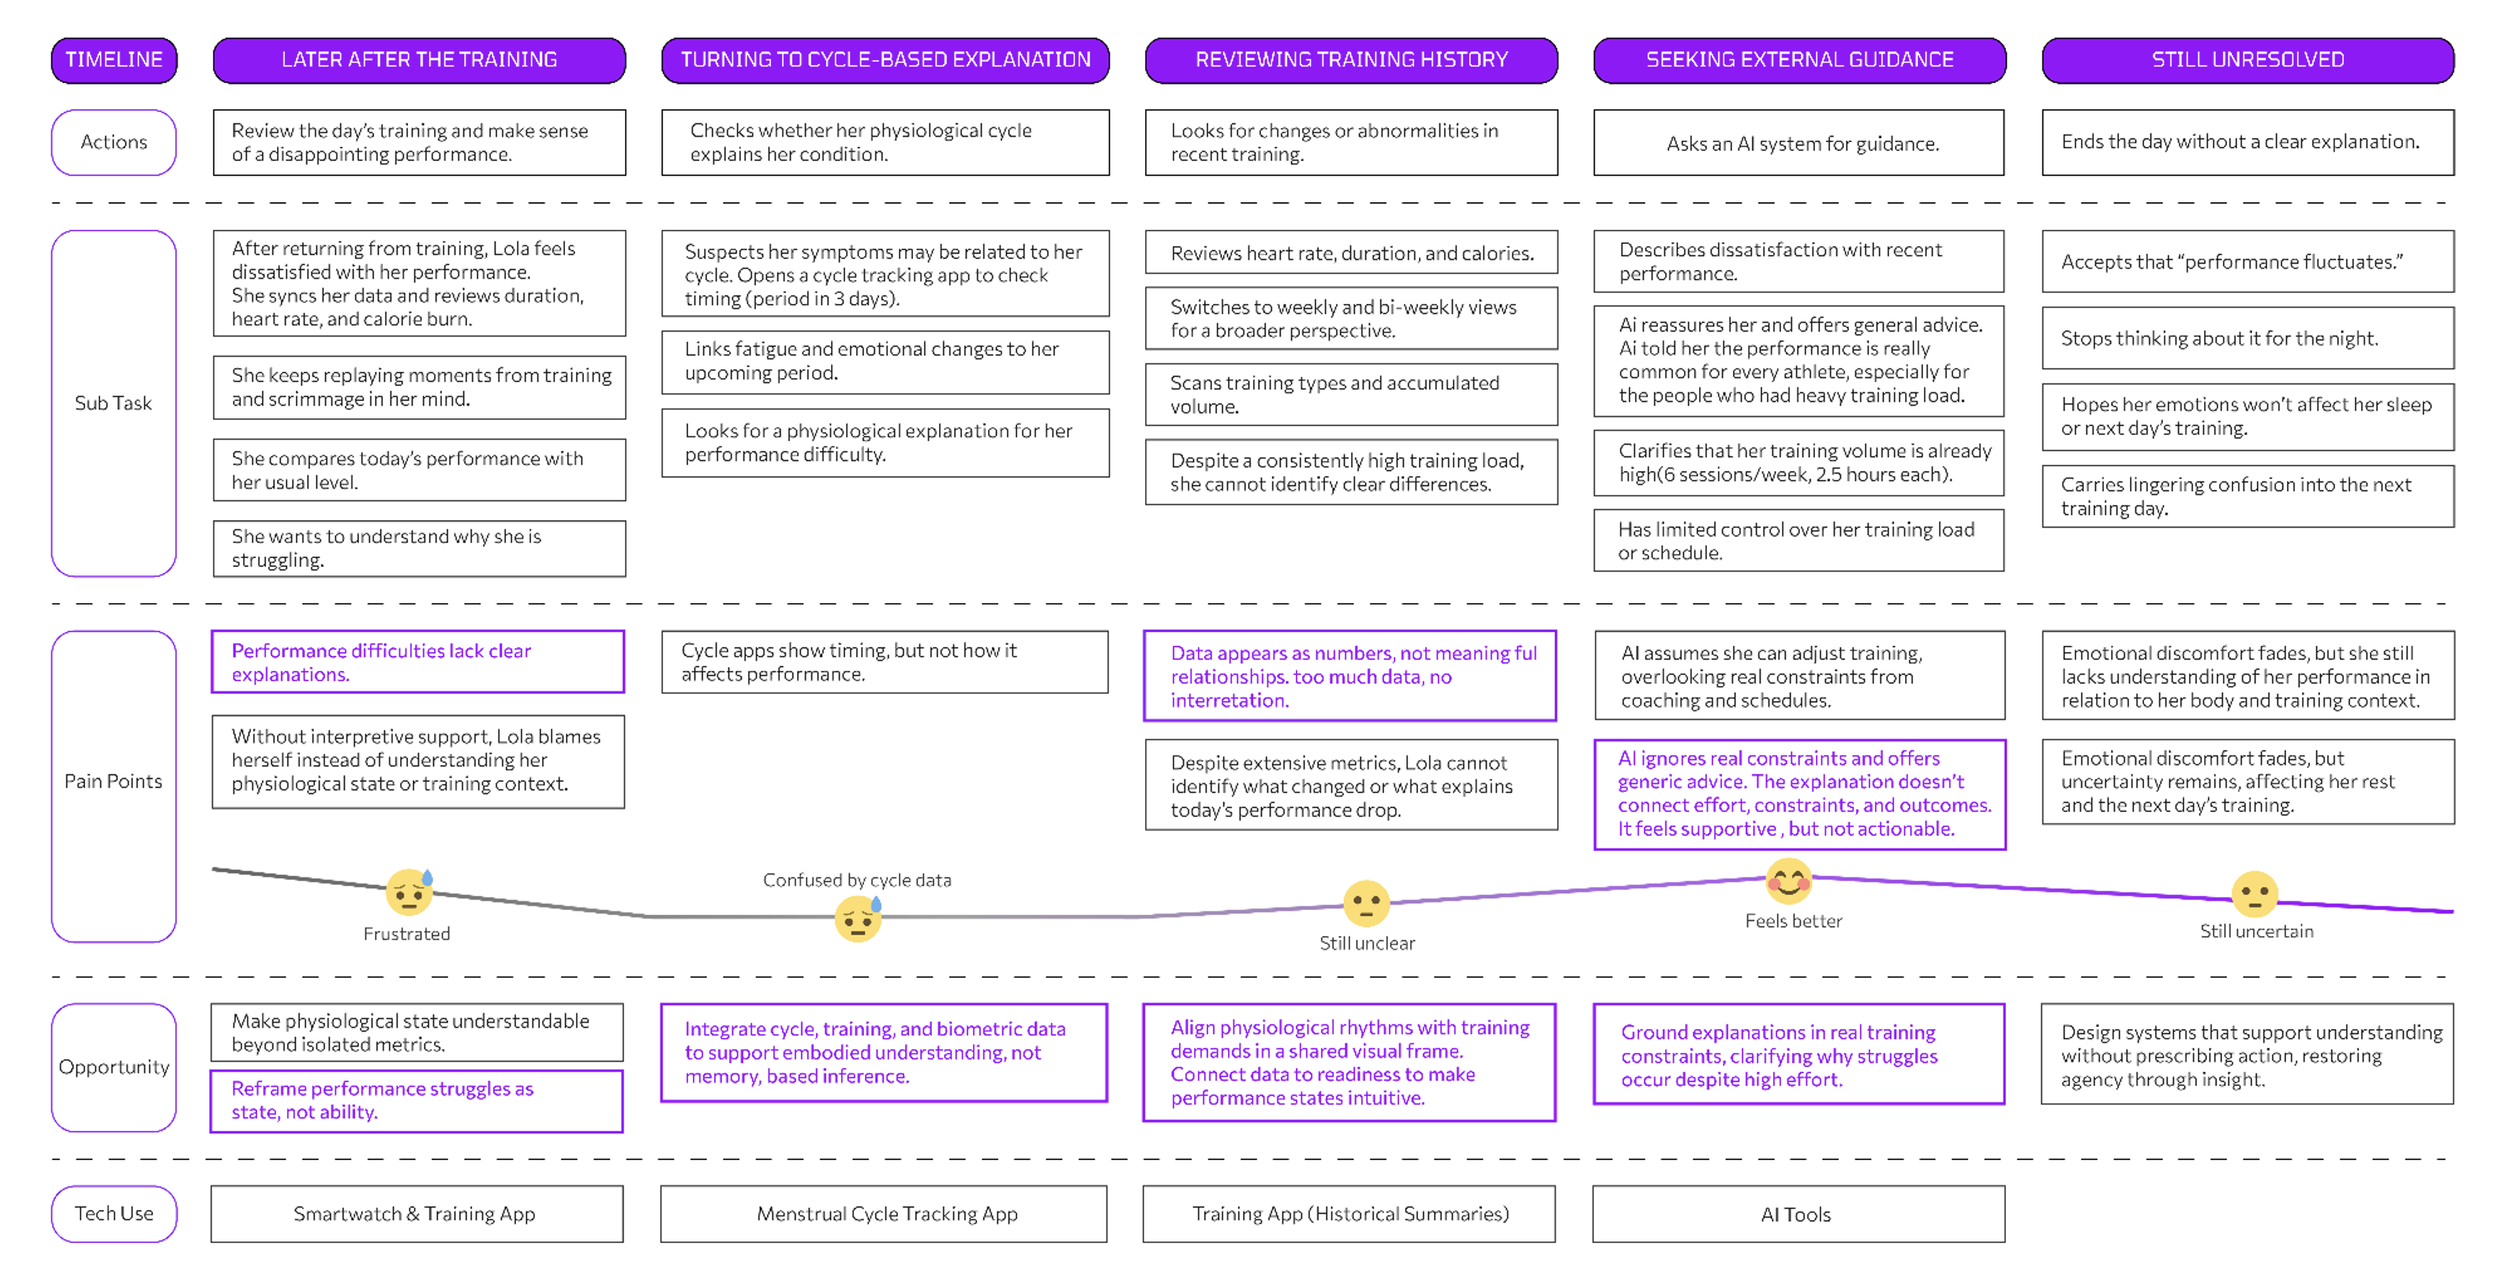
User Journey Map
Research Question
How can the design of a layered, temporal user interface for an AI-supported training system help college women athletes interpret their individual performance reviews by visualizing how training load and physiological data interact to reveal fluctuations in individual performance?
Sub Questions 1
How can multi-modal visualization make the relationship between objective training load and athletes’ internal training experience perceptible, enabling college women athletes to understand fluctuations in their training state?
Sub Questions 2
How can interactive layered explanation interfaces support college women athletes in understanding why a specific training state occurred by revealing how training activities and menstrual cycle phases interact?
Sub Questions 3
How can temporal interface design support college women athletes in understanding how performance difficulties emerge over time by revealing temporal patterns in training load and menstrual cycle variability?
Scenario Video
After an unusually exhausting training session, Lola uses the system to compare today's condition with her personal baseline, review recent patterns, and uncover contributing factors — including cycle phase, accumulated load, and recovery status — before her upcoming competition.
Concept Development
This system of interfaces is designed to address the gap identified in current training systems, where physiological variability and lived bodily experience are often overlooked.
It supports athletes’ sensemaking by connecting external training load with internal bodily experience over time. Through integrated visualization and layered explanations, which help athletes understand performance fluctuations, uncover underlying causes, and navigate future readiness.
External Training Load
Objectively measurable demands (duration, distance, volume) applied to an athlete during training or competition (Soligard et al., 2016).
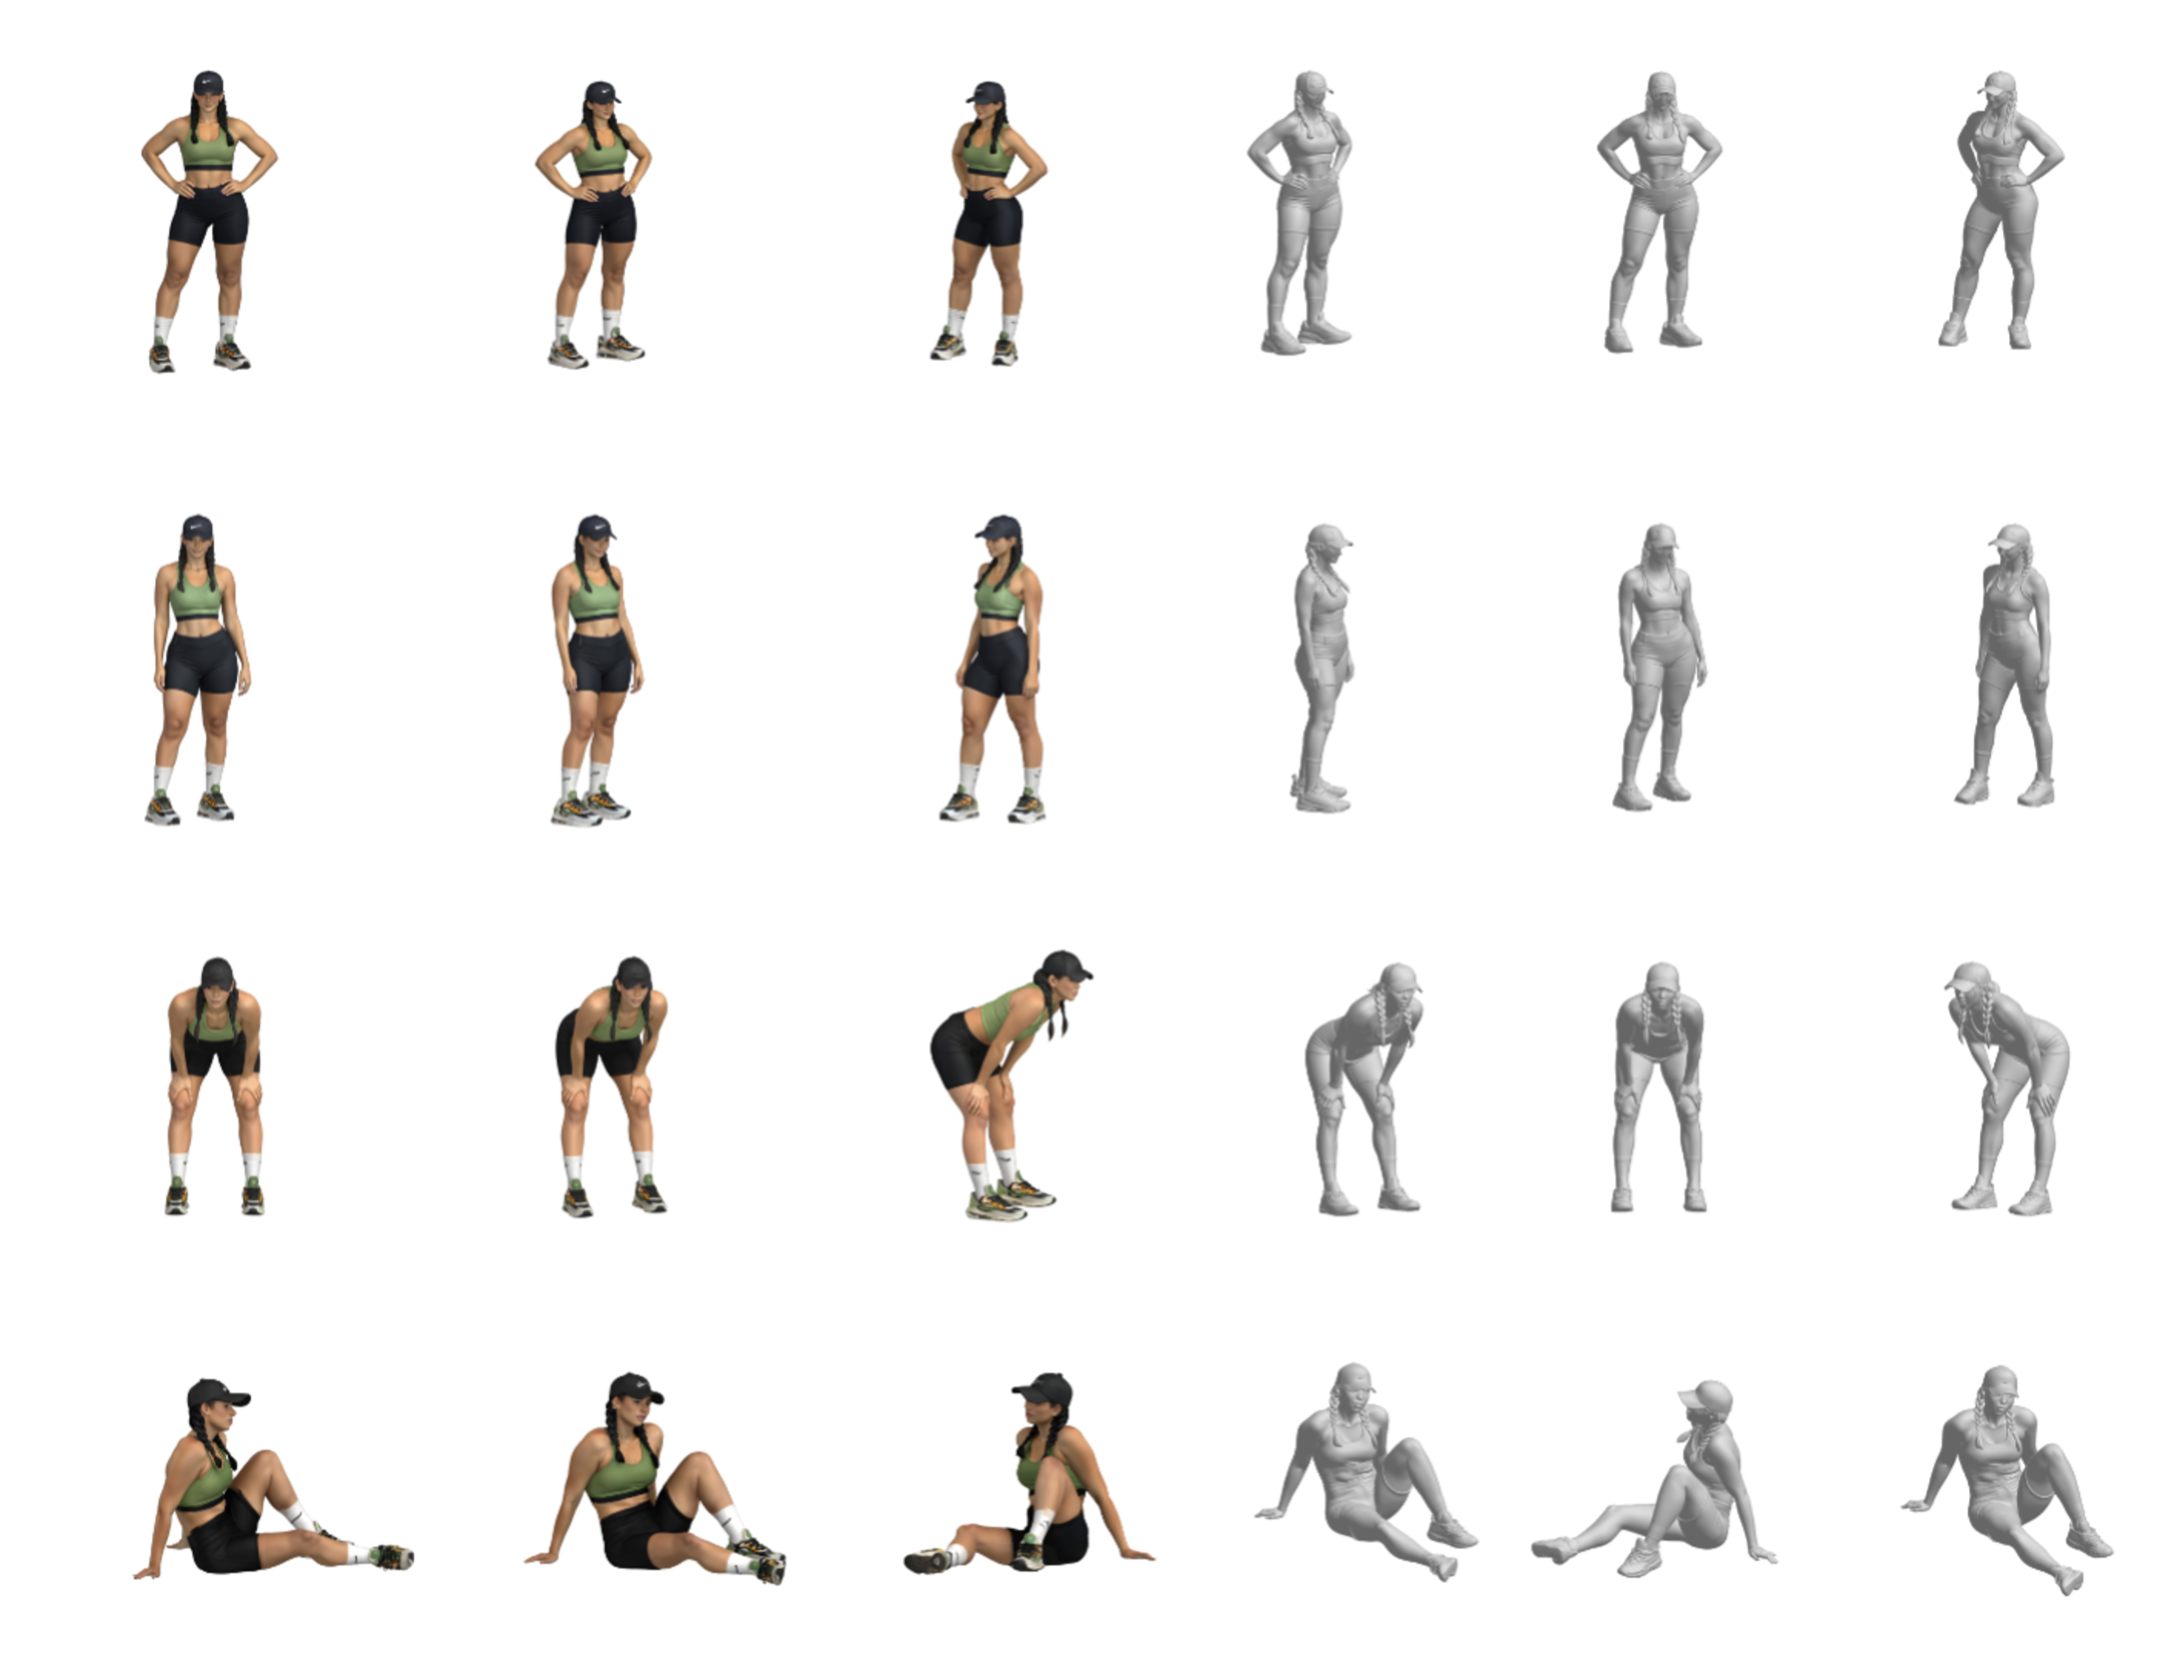
Athlete Internal Experience
Athletes’ subjective responses to training, including perceived effort, stress, and physiological strain.
Athletes’ body language serves as a key indicator of internal states, such as confidence and perceived pressure (Furley & Roth, 2021).
Linking Training Load & Internal Experience
The interface combines objective load metrics with embodied internal-state visuals, allowing athletes to perceive how workload and lived experience change over time.
Layered Explanation — Daily Context
Helps athletes unpack why today’s session felt different by revealing the immediate training and physiological factors behind a single performance state.
From left to right, selecting interactive score markers such as Training Load or Readiness opens a detailed breakdown of the factors contributing to that score.
Layered Explanation — Pattern Over Time
Extends layered explanations across multiple days, helping athletes identify recurring patterns, accumulated fatigue, and cycle-related changes over time.
From left to right, overview filters help athletes focus on flagged patterns, while the chat assistant provides deeper explanations of why those states occurred and how to recover.
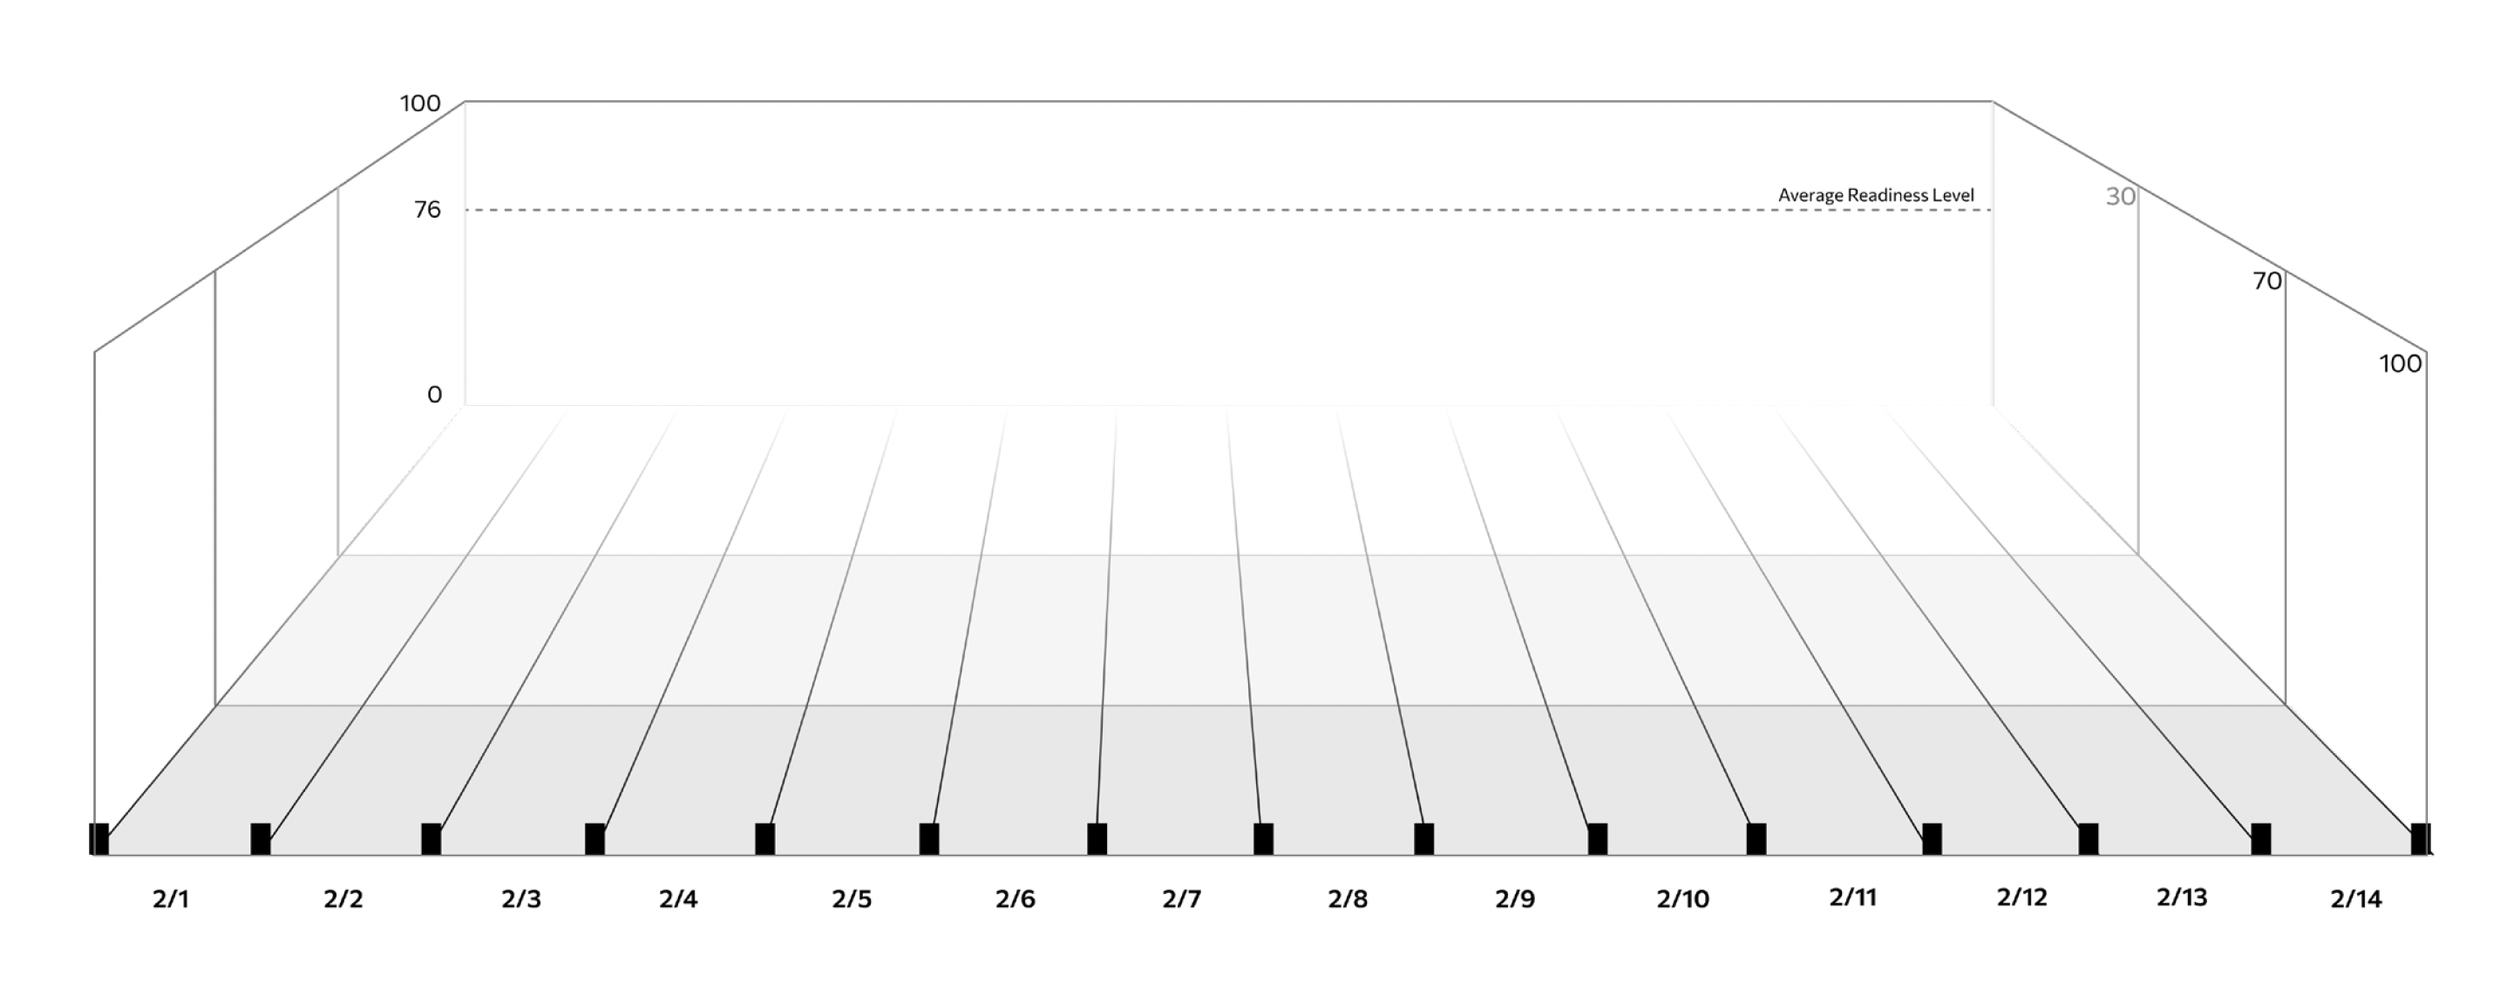
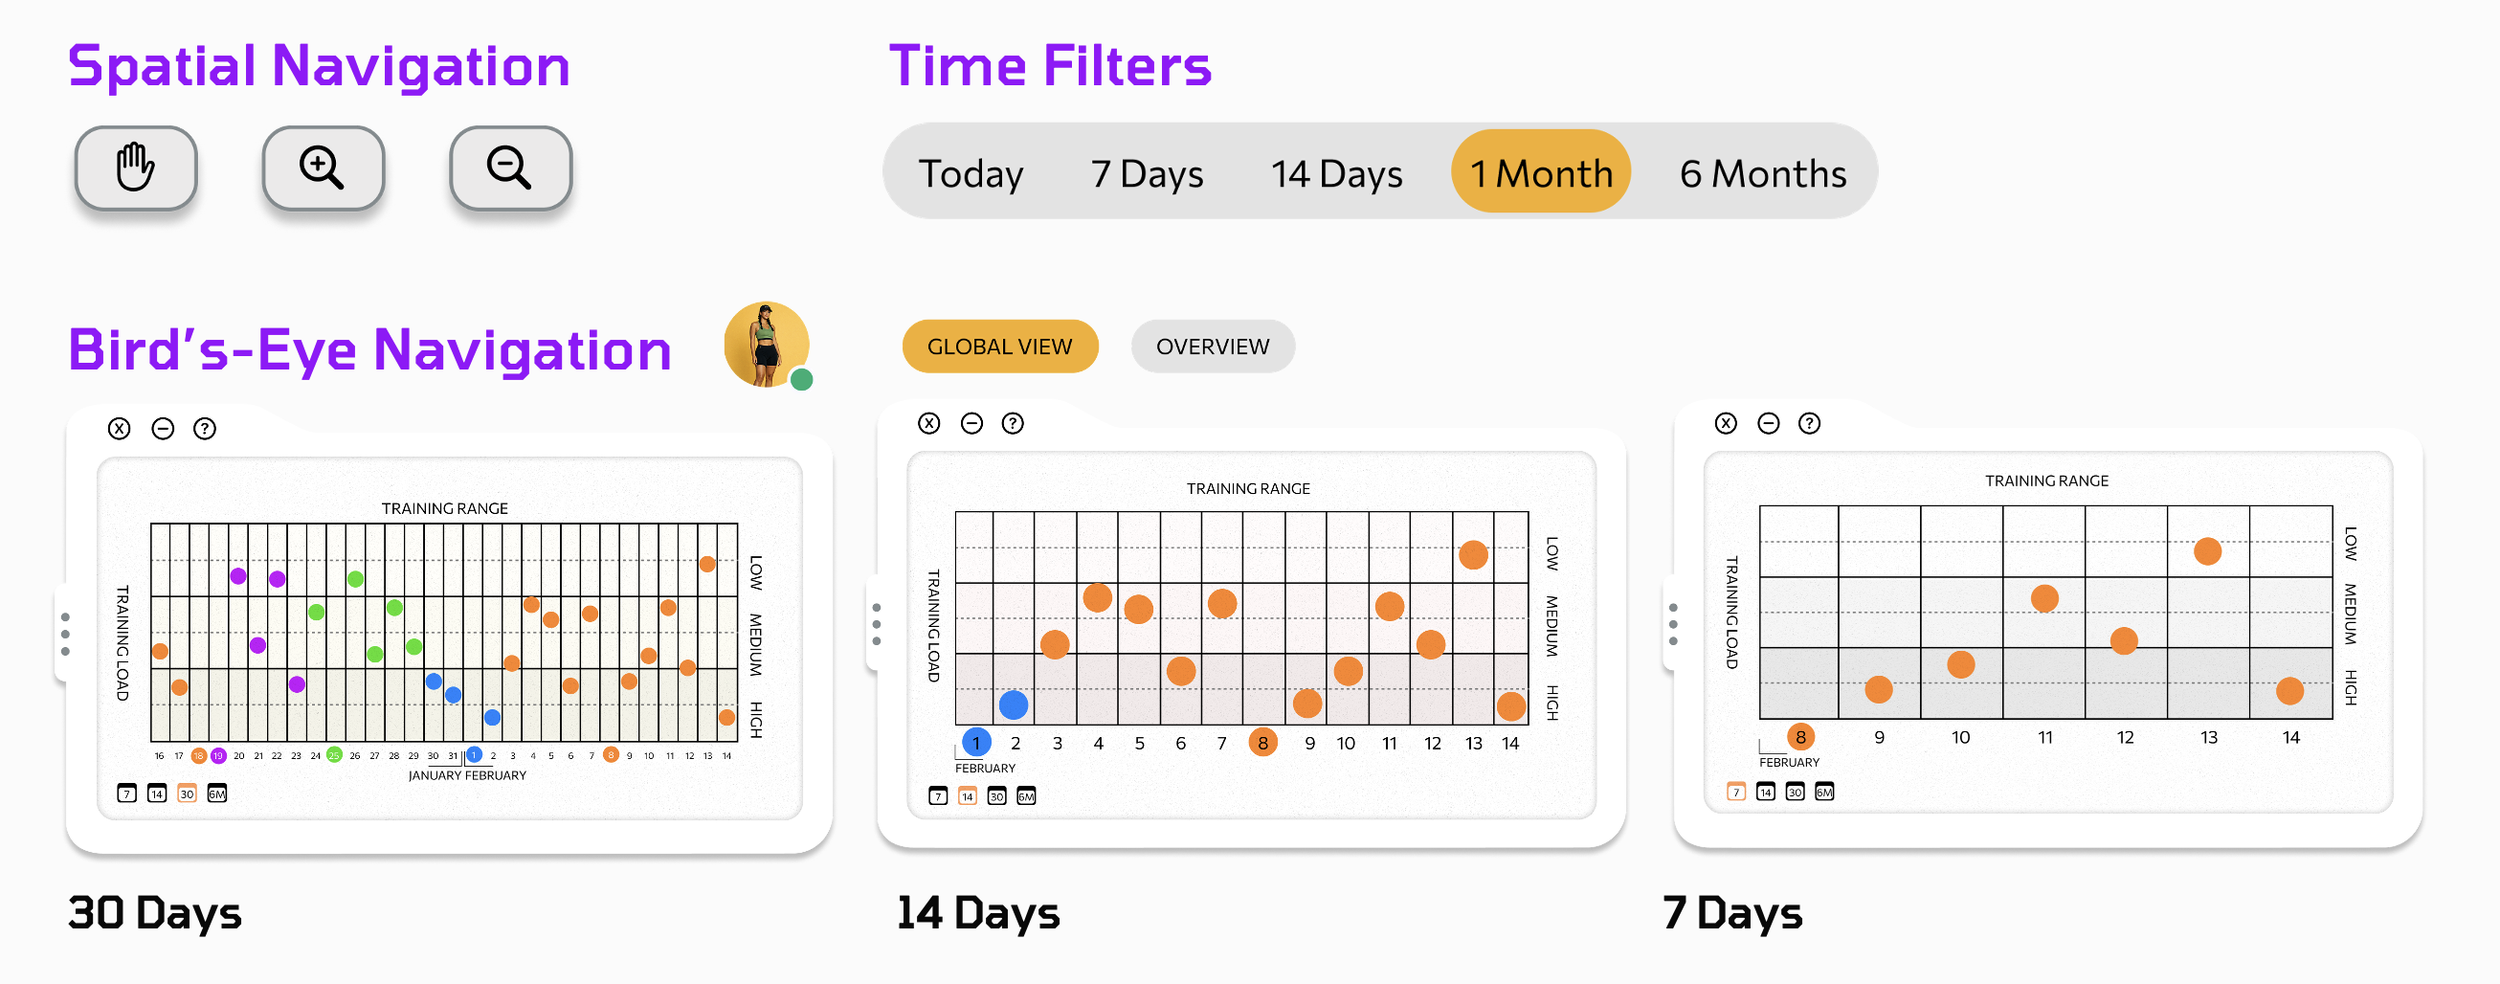
Multi-Scale Temporal Navigation
Multiple time scales allow athletes to move from single sessions to broader patterns across 7, 14, and 30 days. Bird’s-eye navigation and time filters support quick exploration of trends over time.
Temporal Pattern Exploration
A temporal visualization interface that helps athletes identify recurring patterns, compare performance across time, and build longer-term awareness of their changing state.